What is ROAS? (And How to Calculate it Accurately)

Having the tools and capability to measure the effectiveness of your marketing efforts – using widely accepted metrics like ROAS and ROI – has always been an essential part of a marketer’s armoury.
However, against a backdrop that includes the recent pandemic, increasing CPAs in social and other channels and unprecedented structural changes in the market – like the announcement of end of third-party cookies and the iOS14 update from Apple – it now comes under the critical category for marketers.
But what exactly is ROAS, how do you calculate it and what are some of the challenges that marketers are facing around this? In this blog, we aim to give you a quick guide to the topics above and, perhaps, a little bit more.
What is ROAS?
ROAS, or “Return on advertising spend” is a measurement that enables you to assess how much revenue you are generating – or are likely to generate – for a given marketing spend.
It is a key metric for assessing the effectiveness of marketing campaigns and establishing if they are really doing what you intend them to do. By tying revenue generated directly back to ad spend.
ROAS is very much focused around ad effectiveness and assessing which of your adverts are generating, clicks and perhaps most importantly revenue. And is calculated using the formula below:
ROAS = Revenue generated by advertising/Advertising Spend x 100 (to give us a %age but can also be expressed as a ratio)
It will typically involve assessments of campaign effectiveness at a campaign, ad group, creative, impression or keyword level. Depending on the type of marketing activity you are undertaking.
What is the difference between ROAS and ROI?
At this point it is worth pointing out the difference between ROAS and ROI – which is perhaps a more commonly known term. While ROAS is about assessing the effectiveness of specific campaigns and spend, ROI is more about trying to tie performance to the underlying profitability and bottom line of the business as a whole.
The key thing is that both are valid assessments that work in tandem – and we will return to this in more detail in the next section.
How do you calculate ROAS?
The simplest way to explain an ROAS calculation is to layout a practical example.
Take the example below. Let’s assume that a company spends £50,000 on adverts for a product and generates £100,00 in attributable revenue from the exercise.
To calculate the ROAS of this specific activity we use a simple ROAS calculator we outlined in the section above. So, in this case:
ROAS for this Campaign = £150,000/£50,000 x 100 = 300% or a 3:1 return rate
And ROAS of 300% may indicate reasonable return for your efforts depending on your objectives, sector and campaign focus.
In reality, the data below the calculation is also going to be fairly complex but this simple example demonstrates the power of the ROAS calculation itself. In terms of working out how well, or otherwise, your marketing spend is contributing to the business goal of generating revenue.
Again, at this point, it is important to reiterate the importance of the ROI calculation alongside ROAS at a wider business level. ROI is calculated by dividing the Net Profit by Net Spend.
In the example above, the ROAS calculation is showing a return of 300% which appears healthy on the surface.
But let’s also assume that in addition to the £50,000 ad spend there are associated headcount, tools and agency costs totalling £110,000 that also need to be factored in to the ROI equation as follows:
ROI for this campaign = -£10,000/£160,000 = – 6%
In this case, although ROAS calculation on the campaign is healthy – and an indication that you are getting things right with your ad strategy – the reality for the business is that the ROI calculation shows it isn’t profitable once all of the costs are taken into account.
So, it isn’t an either/or decision around ROAS and ROI calculations. They both have their place at the table and its essential to assess them both as you develop your campaign portfolio.
Some practical challenges around calculating ROAS
So, we have laid the groundwork for the type of ROAS calculation we want to make and all of this sounds fine in principle. But the key to success is being able to access the right quality of data to make the ROAS calculation and assessment.
And that’s where many marketers face some very real challenges including:
The poor quality of underlying data being used in your ROAS calculation
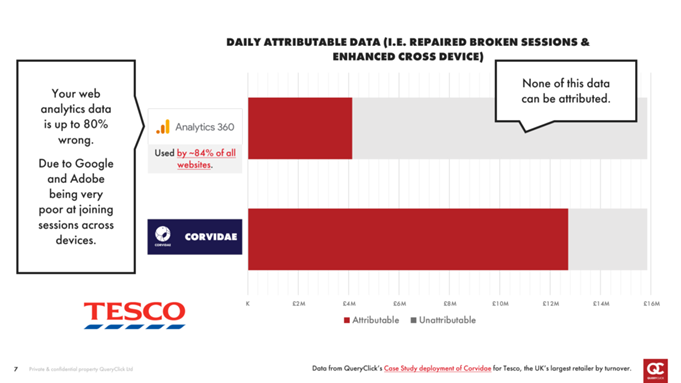
No matter how good your ROAS model is – in reality – it is only as good as the data you feed into it. And our work with clients consistently shows that an incredible 80% of marketing data is attributed inaccurately.
This due to the particularly poor job that some of the traditional analytics platforms like GA360 and Google Analytics do of tying together complex customer journeys – due in part to the flaws in the way that third-party cookies assess these journeys.
In the example on the right, Corvidae was able to take existing Google 360 data for leading UK retailer Tesco and effectively rebuild it. And adjust the level of attributable spend from £4.1m to £13.6m in the process.
The concern of marketers around this issue was also echoed in research by QueryClick that indicated that over 60% of marketers agree that data to support cross-channel decision-making is broken.
An inability to collect and attribute data right across the funnel
Advances in technology have marketers reaching out to consumers in increasingly sophisticated ways across a much wider array of media choices. And consumers are interacting with brands across a range of digital devices – from mobile phone to tablet and laptop – as well as physical locations and a plethora of outdoor media.
Connecting on and offline data and effectively drawing a line through the buying journey that tells you what touchpoints make the real difference to conversion and ROAS is more essential than ever. And as CPAs and competition at the bottom end of the funnel continue to increase being able to find more cost effective, less competitive opportunities further up the funnel is the key to boosting ROAS.
But many marketers are struggling to get the effective, cross-journey attribution view they need and are constrained by outdated models like Last Click which is the default option in Google 360.
Removing impact of data silos and data trust
There is also the issue of overcoming the challenge of bringing together increasingly siloed data and assessing what data you can actually trust.
As campaigns becoming increasingly complex and are influenced by touchpoints up and down the customer journey marketers are having to pull together data. Very often from different teams working across a range of channels from organic, to programmatic to paid search – many of whom are effectively “marking their own homework” and providing a channel view of data that needs unravelling.
In fact, Experian estimate that less than 30% of marketers work in fully integrated teams.
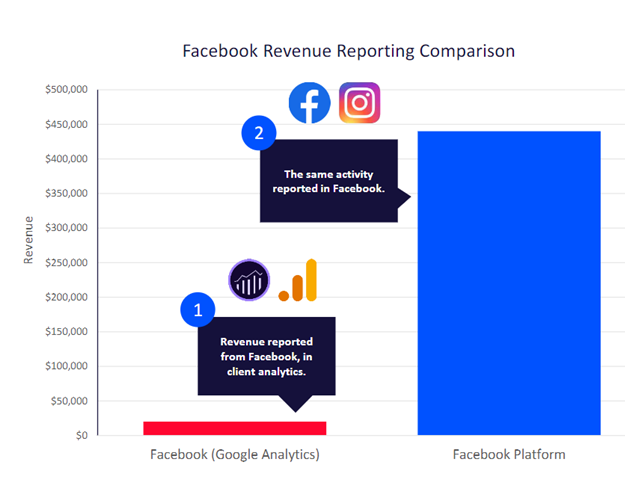
And as more and more spend piles into a small number of channels – like Google and Facebook – you also hit the issue of how social channels report performance data back to you. Using their own, proprietary measurement systems and data view.
The issue is highlighted in the graph on the right – taken from a recent client project – where the revenue reported by Google Analytics (GA 360 in this instance) was showing a fraction of the attributed revenue that Facebook was reporting in the same time period.
The impact of iOS 14 and other changes on ROAS
And as if the challenge for marketers wasn’t tough enough in terms of effective calculation of ROAS a number of industry level changes have made the task a whole lot harder:
Apple’s iOS14 update
The decision by Apple that from April 15 2021 their iOS14 release would make their IDFA a required opt-in on each and every app used.
Ahead of the change Bloomberg had signalled that advertisers were panicking about the impact on paid social. And this appears to have come to pass with 60% of respondents to our most recent survey indicating that they have seen a marked decline in the effectiveness and ROAS of paid ads since the iOS 14.5 update. With issues ranging from serious reductions in audience sizes, to drops in volume, to delayed reporting, to estimated results and a lack of breakdowns to enable ad targeting.
The removal of third-party cookies
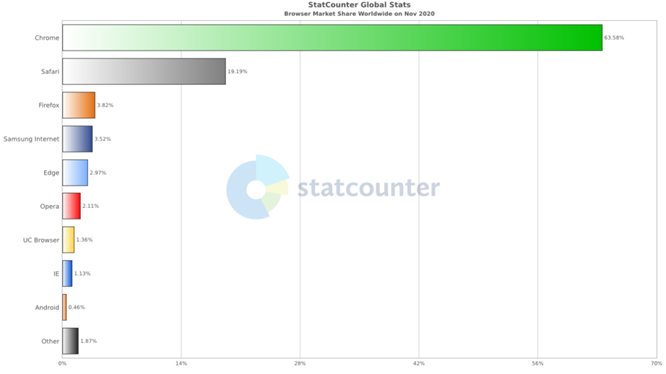
Google that they will be phasing out the use of third-party cookies in 2022.
And the truth is that this really matters. Estimates vary as to the size of Google’s share of the browser market but tend to coalesce in the region of 64% on desktop and 41% on mobile.
And the changes will have major implications for cross-site targeting, behavioural approaches, user analytics and more (relatively) recent innovations like re-targeting.
So the already difficult task of accurately assessing ROAS just got harder.
3 ways to get a clear view on your data and improve your ROAS
So, how do you ensure you have the type of data view that enables you to really drive your ROAS?
- At a fundamental level, ensure that the data you feed into your ROAS calculation is good. Look for an attribution solution that enables you to effectively rebuild your data from the ground up and overcomes the types of inaccuracies that occur from oversimplified attribution views like Last-Click. Advances in Machine Learning and AI mean it is possible to see the user journeys behind your data at a visit level and provide a complete view of the user journey.
- This type of view means that you can overcome the issues caused by siloed and incorrect data. It also reduces the potential impact of iOS 14 and the end of third-party cookies as the Machine Learning and AI techniques effectively replace the cookie – to give a single attributed view across all channels
- Finally, and most importantly, armed with this level of improved insight you are able to make pro-active, near-real-time adjustments to your marketing spend to proactively drive ROAS. Reducing wasted spend by identifying over-investment in channels where returns are artificially inflated by single-touch models and identifying new opportunities to invest in previously under-valued channels with lower CPAs.
Find out more about attribution for Paid Media Marketers here. Or, download our eBook below.